Web UI
The web interface is a real-time dashboard for inspecting all HTTP and HTTPS traffic passing through Laurel Proxy. It runs alongside the proxy and provides instant visibility into every request and response, with filtering, sorting, detail inspection, and request replay.
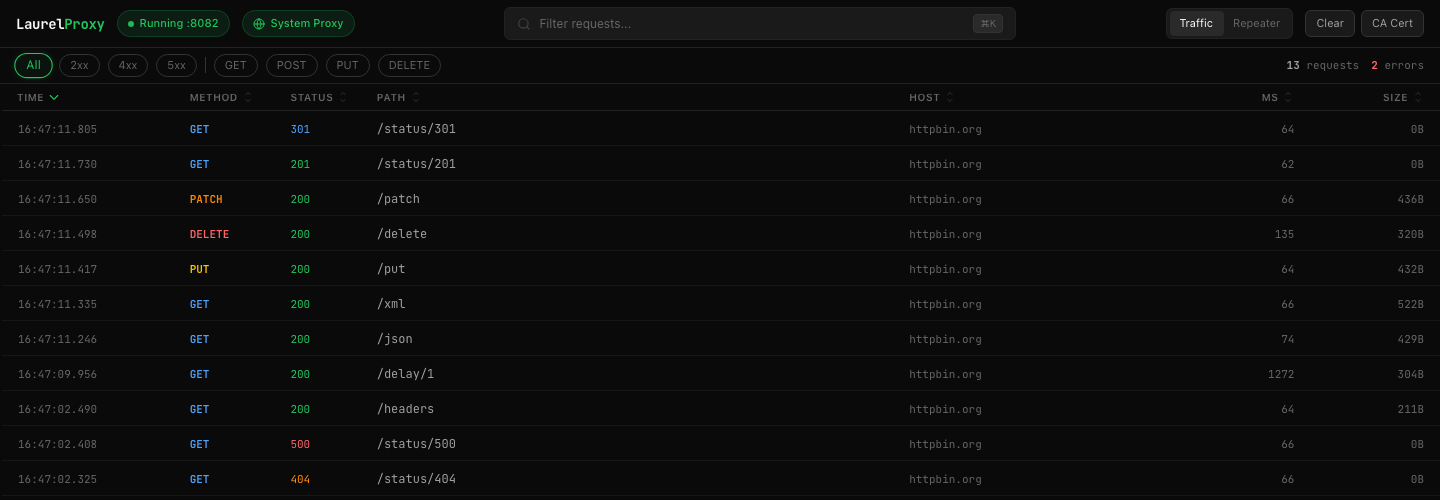
Overview
The web UI is a single-page application that connects to the proxy via Server-Sent Events (SSE) for live updates. It is available at http://127.0.0.1:8081 by default (or whatever port is configured with --ui-port). The interface has two main views:
- Traffic -- the main request list with filters, sorting, and a detail panel
- Repeater -- an editor for crafting and resending captured requests
The top toolbar provides proxy status, search, view switching, and quick actions:

From left to right, the toolbar contains:
- Running :8082 -- proxy status indicator showing the proxy port (green when running)
- System Proxy -- toggle for macOS system proxy routing
- Filter search bar -- full-text URL search with keyboard shortcut hint
- Traffic / Repeater -- view switcher tabs
- Throttle dropdown --
offplus six network presets, and a sliders button for custom rates (see Bandwidth Throttling) - Clear -- delete all captured traffic
- CA Cert -- download the root CA certificate for HTTPS interception
Opening the UI
Start the proxy and open the dashboard:
laurel-proxy start
open http://127.0.0.1:8081
Or use the interactive menu, which has an Open web UI option that auto-starts the proxy if needed:
laurel-proxyIf you started the proxy with custom ports, adjust the URL accordingly:
laurel-proxy start --ui-port 9001
open http://127.0.0.1:9001
Request List
The traffic view shows all captured requests in a table with seven columns:
| Column | Description |
|---|---|
| Time | Timestamp when the request was received (HH:MM:SS.ms) |
| Method | HTTP method, color-coded (green for GET, blue for POST, orange for PUT, etc.). A WebSocket connection's 101 handshake row gets a small WS badge next to the method instead; an h2 client hop gets a small H2 badge (the two never co-occur, since a WebSocket's client hop is always HTTP/1.1) |
| Status | Response status code, color-coded (green for 2xx, yellow for 3xx, orange for 4xx, red for 5xx) |
| Path | Request URL path |
| Host | Target hostname |
| ms | Round-trip time in milliseconds |
| Size | Response body size |
Click any row to open the detail panel. The selected row is highlighted to show which request you are inspecting.
Sortable columns
Click any column header to sort the request list by that field. Click again to reverse the sort order. A sort indicator arrow appears next to the active column header. By default, requests are sorted by time (newest first).
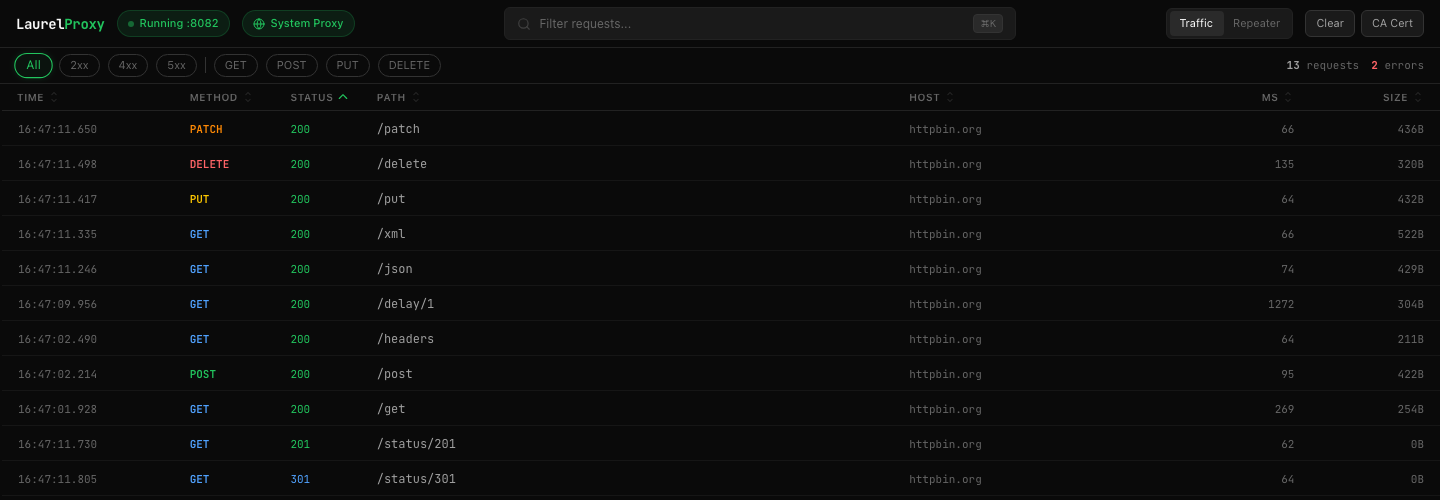
Columns are also resizable -- drag the border between column headers to adjust widths to your preference.
Status counters
Above the column headers on the right side, two counters show at a glance how many requests are currently visible and how many of those are errors (4xx and 5xx status codes). For example, 13 requests 2 errors. When filters are active, the counter updates to show the filtered count out of the total, like 1/13 requests.
Filtering Traffic
The filter bar below the toolbar lets you narrow the request list instantly. There are status code buttons (All, 2xx, 4xx, 5xx), method buttons (GET, POST, PUT, DELETE), and a WS chip for WebSocket connections. Filters can be combined with the URL search bar for precise results.
Status code filters
Click the status code buttons to filter by response category:
- All -- show all requests (default)
- 2xx -- successful responses only
- 4xx -- client errors (400, 401, 403, 404, etc.)
- 5xx -- server errors (500, 502, 503, etc.)

The active filter button is highlighted with a green border. The counter updates to reflect the filtered results.
Method filters
Click a method button to filter by HTTP method: GET, POST, PUT, or DELETE. This is useful when you want to isolate write operations (POST/PUT) from read operations (GET).
WebSocket filter
Click the WS chip to show only WebSocket connections. It filters the traffic list that's already loaded in the browser, the same way the status and method chips do, so it composes with them and with the URL search bar rather than making a separate server request.
URL search
Type in the search bar to filter requests by URL path. The filter is applied instantly as you type -- no need to press Enter. The search matches against the full URL path as a substring. Use the keyboard shortcut Cmd+K (macOS) to focus the search bar quickly.

Combining filters
All filters work together. For example, you can select 5xx + type api in the search bar to find only server errors on API endpoints. Or select POST + type a hostname to see all POST requests to a specific service.
Request Detail Panel
Click any row in the request list to open the detail panel on the right side. The panel shows full request and response information in a resizable split view.
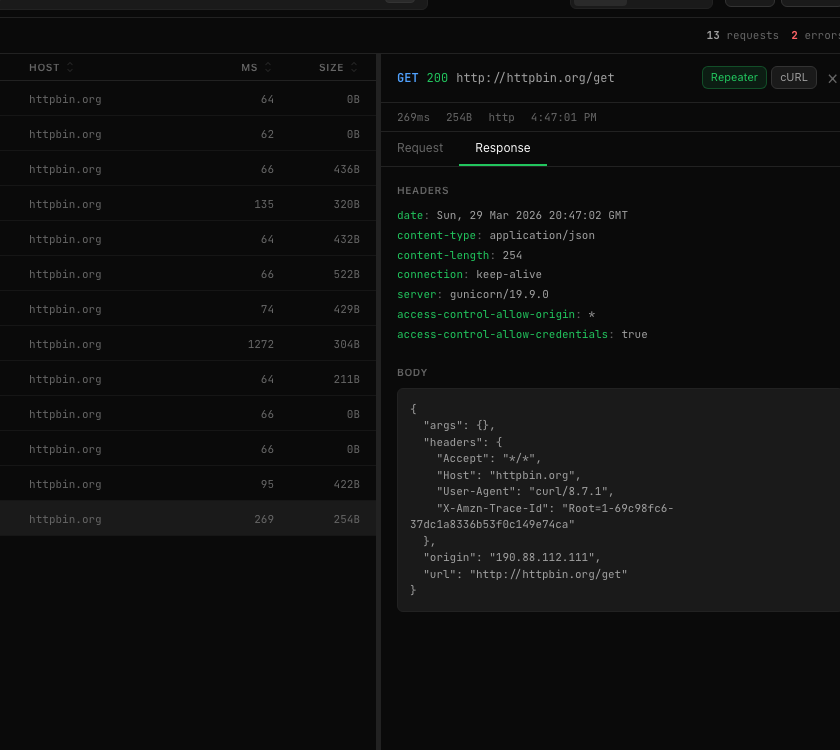
The detail panel header shows:
- The HTTP method, status code, and full URL of the request
- Action buttons: Repeater (send to repeater), cURL (copy as cURL command), and close
- Metadata: response time in milliseconds, response size, protocol (http/https), and timestamp
Response tab
The Response tab (shown by default) displays:
- Headers -- all response headers (content-type, server, cache-control, etc.) displayed as key-value pairs
- Body -- the response body with syntax highlighting for JSON, XML, HTML, and other content types. JSON responses are automatically pretty-printed for readability
Request tab
Switch to the Request tab to see the outgoing request details:
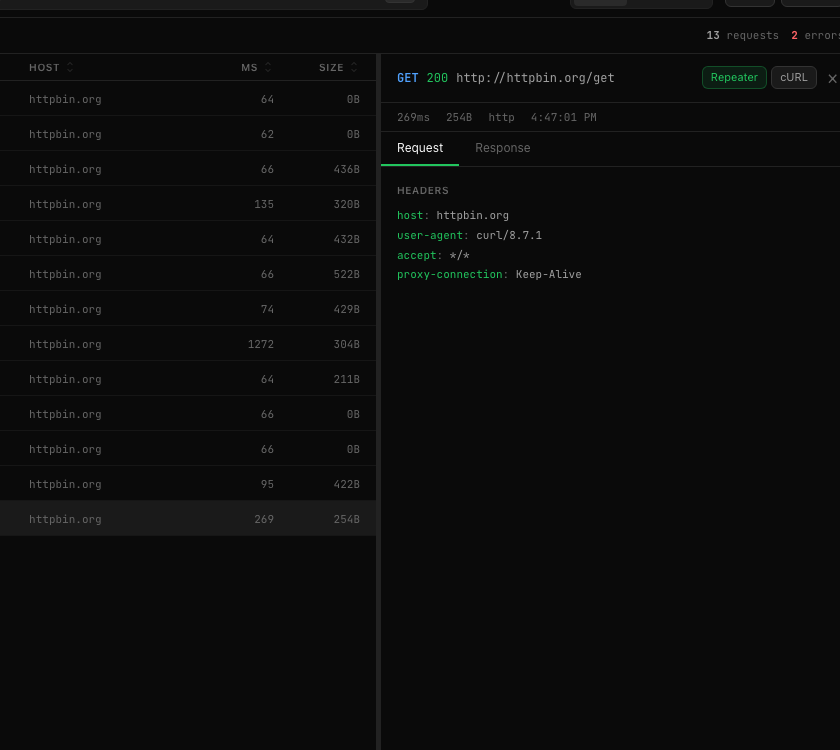
- Headers -- all request headers sent to the server (Host, User-Agent, Content-Type, Authorization, etc.)
- Body -- the request body (for POST, PUT, PATCH requests), with syntax highlighting
Messages tab
Selecting a WebSocket connection's row shows a Messages tab instead of Response/Request. It lists every captured frame in order, with a → for frames sent by the client and ← for frames received from the server, streamed in live via SSE as the connection stays open. A replay button resends the connection's client-sent frames -- the WebSocket analogue of the Repeater -- preserving the original gaps between frames.
Two things worth knowing before you trust what you see: Sec-WebSocket-Extensions is stripped from the upgrade request, so permessage-deflate never gets negotiated on an intercepted connection -- every frame is readable, but the connection itself runs uncompressed. And if the frame decoder gives up on one direction (a malformed frame, an unexpected compression bit, or a frame over the 32 MiB cap), the relay keeps that direction working but silently stops recording it -- there is currently no error or badge that surfaces this, so a connection that looks one-sided is the first thing to suspect.
Detail metadata
The metadata bar between the title and the tabs shows:
| Field | Description |
|---|---|
| ms | Response time in milliseconds (e.g., 95ms) |
| Size | Response body size (e.g., 422B) |
| Protocol | Whether the request used HTTP or HTTPS |
| Timestamp | When the request was made (e.g., 4:47:02 PM) |
| Client hop → Origin hop | Wire protocol negotiated with the client and with the origin, shown together (e.g. h2 → http/1.1). Reads unknown for a legacy row predating this field rather than guessing |
cURL export
Click the cURL button in the detail panel header to copy a cURL command for the selected request to your clipboard. The generated command includes the method, URL, headers, and body, so you can replay the exact request from your terminal. This is useful for sharing requests with teammates or testing from the command line.
Repeater
The Repeater is a built-in HTTP client for crafting and resending requests. Switch to the Repeater view using the Repeater tab in the top toolbar, or send any captured request to the Repeater by clicking the Repeater button in the detail panel.
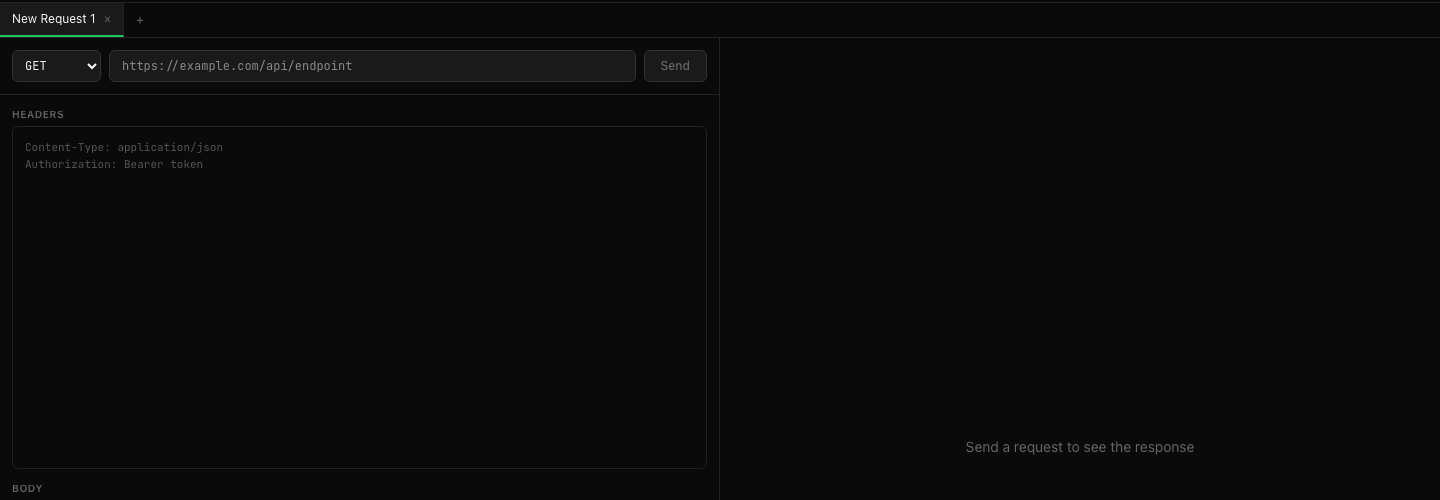
The Repeater editor is split into two halves:
- Left: Request editor
- Method dropdown -- select GET, POST, PUT, PATCH, DELETE, HEAD, or OPTIONS
- URL field -- the full URL to send the request to
- Headers editor -- free-text area for custom headers (one per line,
Name: Valueformat) - Body editor -- free-text area for the request body (JSON, form data, etc.)
- Send button -- sends the request through the proxy
- Right: Response viewer -- displays the response after sending, with headers and body
You can open multiple Repeater tabs simultaneously (each tab is a separate request). Click the + button to add a new tab, or click x to close one. When you send a captured request to the Repeater from the traffic view, it opens in a new tab pre-filled with the original method, URL, headers, and body.
Bandwidth Throttling
The toolbar's throttle dropdown offers off plus six presets modeled on real connection types: 56k, edge, 3g, 4g, dsl, and wifi. It shows custom (disabled, unselectable) whenever the live settings don't match any preset exactly.
A small sliders button next to the dropdown opens a popover with Down (kbps), Up (kbps), and Latency (ms) fields for arbitrary values, equivalent to the CLI's --down/--up/--latency flags. A rejected value (negative, non-finite, or a failed config write) is shown inline in the popover with the server's own error text, and the fields keep your input rather than resetting -- nothing is ever applied optimistically.
Throttling models one shared virtual link per direction, so concurrent connections contend for the same bandwidth budget rather than each getting the full rate. This also means it inflates the recorded duration of affected requests -- the throttle dropdown's tooltip and an accent * badge on the traffic table's duration column both call this out while throttling is enabled, the same way Chrome DevTools marks throttled network timing.
Proxy Controls
The top toolbar includes two proxy control buttons:
- Running :8082 -- shows the current proxy status and port. Click to stop or start the proxy directly from the web UI. The status indicator turns green when the proxy is running.
- System Proxy -- enables or disables macOS system proxy routing. When enabled, all system HTTP/HTTPS traffic is routed through Laurel Proxy automatically. This is equivalent to running
laurel-proxy proxy-onfrom the CLI.
Proxy state is synchronized between the web UI and CLI in real-time. If you stop the proxy from the CLI, the web UI updates within a second, and vice versa.
The Clear button deletes all captured traffic from the database. This is the same as running laurel-proxy clear from the CLI.
Real-time Streaming
The web UI uses Server-Sent Events (SSE) to stream new requests in real-time as they pass through the proxy. You do not need to refresh the page -- new requests appear at the top of the list automatically.
Key behaviors:
- Auto-scroll -- when viewing the top of the list, new requests scroll into view automatically
- Historical data -- previously captured requests load automatically when you open the page
- Connection recovery -- if the SSE connection drops (e.g., proxy restart), the UI reconnects automatically
- Event batching -- SSE events are buffered for 100ms before flushing to prevent overwhelming the UI during traffic bursts
Keyboard Shortcuts
| Shortcut | Action |
|---|---|
Cmd+K | Focus the search bar |
Escape | Close the detail panel or clear the search |
Related
- Getting Started - Install and capture your first request
- REST API - The API powering the web dashboard
- HTTPS Interception - Capture HTTPS traffic in the UI
- HTTP/2 Support - The H2 badge and client/origin hop fields
- CLI Reference - Command-line alternative for querying traffic